Risk ManagementLibrary "RiskManagement"
This library keeps your money in check, and is used for testing and later on webhook-applications too. It has four volatility functions and two of them can be used to calculate a Stop-Loss, like Average True Range. It also can calculate Position Size, and the Risk Reward Ratio. But those calculations don't take leverage into account.
position_size(portfolio, risk, entry, stop_loss, use_leverage, qty_as_integer)
This function calculates the definite amount of contracts/shares/units you should use to buy or sell. This value can used by `strategy.entry(qty)` for example.
Parameters:
portfolio (float) : This is the total amount of the currency you own, and is also used by strategy.initial_capital, for example. The amount is needed to calculate the maximum risk you are willing to take per trade.
risk (float) : This is the percentage of your Portfolio you willing to loose on a single trade. Possible values are between 0.1 and 100%. Same usecase with strategy(default_qty_type=strategy.percent_of_equity,default_qty_value=100), except its calculation the risk only.
entry (float) : This is the limit-/market-price for the investment. In other words: The price per contract/share/unit you willing to buy or sell.
stop_loss (float) : This is the limit-/market-price when to exit the trade, to minimize your losses.
use_leverage (bool) : This value is optional. When not used or when set to false then this function will let you invest your portfolio at max.
qty_as_integer (bool) : This value is optional. When set to true this function will return a value used with integers. The largest integer less than or equal to the given number. Because some Broker/Exchanges let you trade hole contracts/shares/units only.
Returns: float
position_size_currency(portfolio, risk, entry, stop_loss)
This function calculates the definite amount of currency you should use when going long or short.
Parameters:
portfolio (float) : This is the total amount of the currency you own, and is also used by strategy.initial_capital, for example. The amount is needed to calculate the maximum risk you are willing to take per trade.
risk (float) : This is the percentage of your Portfolio you willing to loose on a single trade. For example: 1 is 100% and 0,01 is 1%. Default amount is 0.02 (2%).
entry (float) : This is the limit-/market-price for the current investment. In other words: The price per contract/share/units you willing to buy or sell.
stop_loss (float) : This is the limit-/market-price when to exit the trade, to minimize your losses.
Returns: float
rrr(entry, stop_loss, take_profit)
This function calculates the Risk Reward Ratio. Common values are between 1.5 and 2.0 and you should not go lower except for very few special cases.
Parameters:
entry (float) : This is the limit-/market-price for the investment. In other words: The price per contract/share/unit you willing to buy or sell.
stop_loss (float) : This is the limit-/market-price when to exit the trade, to minimize your losses.
take_profit (float) : This is the limit-/market-price when to take profits.
Returns: float
change_in_price(length)
This function calculates the difference between price now and close price of the candle 'n' bars before that. If prices are very volatile but closed where they began, then this method would show zero volatility. Over many calculations, this method returns a reasonable measure of volatility, but will always be lower than those using the highs and lows.
Parameters:
length (int) : The length is needed to determine how many candles/bars back should take into account.
Returns: float
maximum_price_fluctuation(length)
This function measures volatility over most recent candles, which could be used as an estimate of risk. It may also be effective as the basis for a stop-loss or take-profit, like the ATR but it ignores the frequency of directional changes within the time interval. In other words: The difference between the highest high and lowest low over 'n' bars.
Parameters:
length (int) : The length is needed to determine how many candles/bars back should take into account.
Returns: float
absolute_price_changes(length)
This function measures volatility over most recent close prices. This is excellent for comparing volatility. It includes both frequency and magnitude. In other words: Sum of differences between second to last close price and last close price as absolute value for 'n' bars.
Parameters:
length (int) : The length is needed to determine how many candles/bars back should take into account.
Returns: float
annualized_volatility(length)
This function measures volatility over most recent close prices. Its the standard deviation of close over the past 'n' periods, times the square root of the number of periods in a year.
Parameters:
length (int) : The length is needed to determine how many candles/bars back should take into account.
Returns: float
Cari dalam skrip untuk "take profit"
D-BoT Alpha 'Short' SMA and RSI StrategyDostlar selamlar,
İşte son derece basit ama etkili ve hızlı, HTF de çok iyi sonuçlar veren bir strateji daha, hepinize bol kazançlar dilerim ...
Nedir, Nasıl Çalışır:
Strateji, iki ana girdiye dayanır: SMA ve RSI. SMA hesaplama aralığı 200 olarak, RSI ise 14 olarak ayarlanmıştır. Bu değerler, kullanıcı tercihlerine veya geriye dönük test sonuçlarına göre ayarlanabilir.
Strateji, iki koşul karşılandığında bir short sinyali oluşturur: RSI değeri, belirlenen bir giriş seviyesini (burada 51 olarak belirlenmiş) aşar ve kapanış fiyatı SMA değerinin altındadır.
Strateji, kısa pozisyonu üç durumda kapatır: Kapanış fiyatı, takip eden durdurma seviyesinden (pozisyon açıldığından beri en düşük kapanış olarak belirlenmiştir) büyükse, RSI değeri belirlenen bir durdurma seviyesini (bu durumda 54) aşarsa veya RSI değeri belirli bir kar al seviyesinin (bu durumda 32) altına düşerse.
Güçlü Yönleri:
İki farklı gösterge (SMA ve RSI) kullanımı, yalnızca birini kullanmaktan daha sağlam bir sinyal sağlayabilir.
Strateji, karları korumaya ve fiyat dalgalanmalarında kayıpları sınırlamaya yardımcı olabilecek bir iz süren durdurma seviyesi içerir.
Script oldukça anlaşılır ve değiştirmesi nispeten kolaydır.
Zayıf Yönleri:
Strateji, hacim, oynaklık veya daha geniş piyasa eğilimleri gibi diğer potansiyel önemli faktörleri göz önünde bulundurmaz.
RSI seviyeleri ve SMA süresi için belirli parametreler sabittir ve tüm piyasa koşulları veya zaman aralıkları için optimal olmayabilir.
Strateji oldukça basittir. Trade maliyetini (kayma veya komisyonlar gibi) hesaba katmaz, bu da trade performansını önemli ölçüde etkileyebilir.
Bu Stratejiyle Nasıl İşlem Yapılır:
Strateji, short işlemler için tasarlanmıştır. RSI, 51'in üzerine çıktığında ve kapanış fiyatı 200 periyotluk SMA'nın altında olduğunda işleme girer. RSI, 54'ün üzerine çıktığında veya 32'nin altına düştüğünde veya fiyat, pozisyon açıldığından beri en düşük kapanış fiyatının üzerine çıktığında işlemi kapatır.
Lütfen Dikkat, bu strateji veya herhangi bir strateji izole bir şekilde kullanılmamalıdır. Tüm bu çalışmalar eğitsel amaçlıdır. Yatırım tavsiyesi içermez.
This script defines a trading strategy based on Simple Moving Average (SMA) and the Relative Strength Index (RSI) indicators. Here's an overview of how it works, along with its strengths and weaknesses, and how to trade using this strategy:
How it works:
The strategy involves two key inputs: SMA and RSI. The SMA length is set to 200, and the RSI length is set to 14. These values can be adjusted based on user preferences or back-testing results.
The strategy generates a short signal when two conditions are met: The RSI value crosses over a defined entry level (set at 51 here), and the closing price is below the SMA value.
When a short signal is generated, the strategy opens a short position.
The strategy closes the short position under three conditions: If the close price is greater than the trailing stop (which is set as the lowest close since the position opened), if the RSI value exceeds a defined stop level (54 in this case), or if the RSI value drops below a certain take-profit level (32 in this case).
Strengths:
The use of two different indicators (SMA and RSI) can provide a more robust signal than using just one.
The strategy includes a trailing stop, which can help to protect profits and limit losses as the price fluctuates.
The script is straightforward and relatively easy to understand and modify.
Weaknesses:
The strategy doesn't consider other potentially important factors, such as volume, volatility, or broader market trends.
The specific parameters for the RSI levels and SMA length are hard-coded, and may not be optimal for all market conditions or timeframes.
The strategy is very simplistic. It doesn't take into account the cost of trading (like slippage or commissions), which can significantly impact trading performance.
How to trade with this strategy:
The strategy is designed for short trades. It enters a trade when the RSI crosses above 51 and the closing price is below the 200-period SMA. It will exit the trade when the RSI goes above 54 or falls below 32, or when the price rises above the lowest closing price since the position was opened.
Please note, this strategy or any strategy should not be used in isolation. It's important to consider other aspects of trading such as risk management, capital allocation, and combining different strategies to diversify. Back-testing the strategy on historical data and demo trading before going live is also a recommended practice.

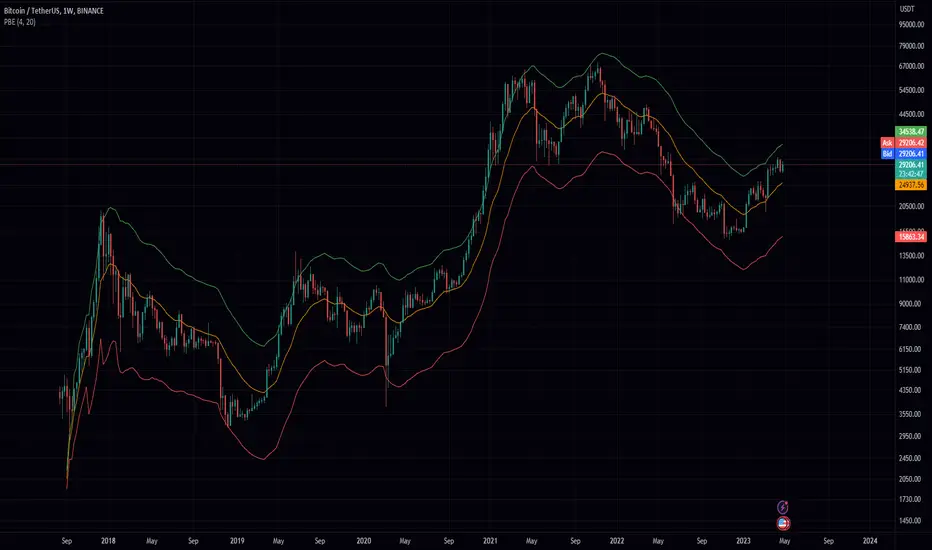
Probability Envelopes (PBE)Introduction
In the world of trading, technical analysis is vital for making informed decisions about the future direction of an asset's price. One such tool is the use of indicators, mathematical calculations that can help traders predict market trends. This article delves into an innovative indicator called the Probability Envelopes Indicator, which offers valuable insights into the potential price levels an asset may reach based on historical data. This in-depth look explores the statistical foundations of the indicator, highlighting its key components and benefits.
Section 1: Calculating Price Movements with Log Returns and Percentages
The Probability Envelopes Indicator provides the option to use either log returns or percentage changes when calculating price movements. Each method has its advantages:
Log Returns: These are calculated as the natural logarithm of the ratio of the current price to the previous price. Log returns are considered more stable and less sensitive to extreme price fluctuations.
Percentage Changes: These are calculated as the percentage difference between the current price and the previous price. They are simpler to interpret and easier to understand for most traders.
Section 2: Understanding Mean, Variance, and Standard Deviation
The Probability Envelopes Indicator utilizes various statistical measures to analyze historical price movements:
Mean: This is the average of a set of numbers. In the context of this indicator, it represents the average price movement for bullish (green) and bearish (red) scenarios.
Variance: This measure represents the dispersion of data points in a dataset. A higher variance indicates a greater spread of data points from the mean. Variance is calculated as the average of the squared differences from the mean.
Standard Deviation: This is the square root of the variance. It is a measure of the amount of variation or dispersion in a dataset. In the context of this indicator, standard deviations are used to calculate the width of the bands around the expected mean.
Section 3: Analyzing Historical Price Movements and Probabilities
The Probability Envelopes Indicator examines historical price movements and calculates probabilities based on their frequency:
The indicator first identifies and categorizes price movements into bullish (green) and bearish (red) scenarios.
It then calculates the probability of each price movement occurring by dividing the frequency of the movement by the total number of occurrences in each category (bullish or bearish).
The expected green and red movements are calculated by multiplying the probabilities by their respective price movements and summing the results.
The total expected movement, or weighted average, is calculated by combining the expected green and red movements and dividing by the total number of occurrences.
Section 4: Constructing the Probability Envelopes
The Probability Envelopes Indicator utilizes the calculated statistics to construct its bands:
The expected mean is calculated using the total expected movement and applied to the current open price.
An exponential moving average (EMA) is used to smooth the expected mean, with the smoothing length determining the degree of responsiveness.
The upper and lower bands are calculated by adding and subtracting the mean green and red movements, respectively, along with their standard deviations multiplied by a user-defined multiplier.
Section 5: Benefits of the Probability Envelopes Indicator
The Probability Envelopes Indicator offers numerous advantages to traders:
Enhanced Decision-Making: By providing probability-based estimations of future price levels, the indicator can help traders make more informed decisions and potentially improve their trading strategies.
Versatility: The indicator is applicable to various financial instruments, such as stocks, forex, commodities, and cryptocurrencies, making it a valuable tool for traders in different markets.
Customization: The indicator's parameters, including the use of log returns, multiplier values, and smoothing length, can be adjusted according to the user's preferences and trading style. This flexibility allows traders to fine-tune the Probability Envelopes Indicator to better suit their needs and goals.
Risk Management: The Probability Envelopes Indicator can be used as a component of a risk management strategy by providing insight into potential price movements. By identifying potential areas of support and resistance, traders can set stop-loss and take-profit levels more effectively.
Visualization: The graphical representation of the indicator, with its clear upper and lower bands, makes it easy for traders to quickly assess the market and potential price levels.
Section 6: Integrating the Probability Envelopes Indicator into Your Trading Strategy
When incorporating the Probability Envelopes Indicator into your trading strategy, consider the following tips:
Confirmation Signals: Use the indicator in conjunction with other technical analysis tools, such as trend lines, moving averages, or oscillators, to confirm the strength and direction of the market trend.
Timeframes: Experiment with different timeframes to find the optimal settings for your trading strategy. Keep in mind that shorter timeframes may generate more frequent signals but may also increase the likelihood of false signals.
Risk Management: Always establish a proper risk management strategy that includes setting stop-loss and take-profit levels, as well as managing your position sizes.
Backtesting: Test the Probability Envelopes Indicator on historical data to evaluate its effectiveness and fine-tune its parameters to optimize your trading strategy.
Section 7: Cons and Limitations of the Probability Envelopes Indicator
While the Probability Envelopes Indicator offers several advantages to traders, it is essential to be aware of its potential cons and limitations. Understanding these can help you make better-informed decisions when incorporating the indicator into your trading strategy.
Lagging Nature: The Probability Envelopes Indicator is primarily based on historical data and price movements. As a result, it may be less responsive to real-time changes in market conditions, and the predicted price levels may not always accurately reflect the market's current state. This lagging nature can lead to late entry and exit signals.
False Signals: As with any technical analysis tool, the Probability Envelopes Indicator can generate false signals. These occur when the indicator suggests a potential price movement, but the market does not follow through. It is crucial to use other technical analysis tools to confirm the signals and minimize the impact of false signals on your trading decisions.
Complex Statistical Concepts: The Probability Envelopes Indicator relies on complex statistical concepts and calculations, which may be challenging to grasp for some traders, particularly beginners. This complexity can lead to misunderstandings and misuse of the indicator if not adequately understood.
Overemphasis on Past Data: While historical data can be informative, relying too heavily on past performance to predict future movements can be limiting. Market conditions can change rapidly, and relying solely on past data may not provide an accurate representation of the current market environment.
No Guarantees: The Probability Envelopes Indicator, like all technical analysis tools, cannot guarantee success. It is essential to approach trading with realistic expectations and understand that no indicator or strategy can provide foolproof results.
To overcome these limitations, it is crucial to combine the Probability Envelopes Indicator with other technical analysis tools and utilize a comprehensive risk management strategy. By doing so, you can better understand the market and increase your chances of success in the ever-changing financial markets.
Section 8: Probability Envelopes Indicator vs. Bollinger Bands
Bollinger Bands and the Probability Envelopes Indicator are both technical analysis tools designed to identify potential support and resistance levels, as well as potential trend reversals. However, they differ in their underlying concepts, calculations, and applications. This section will provide a deep dive into the differences between these two indicators and how they can complement each other in a trading strategy.
Underlying Concepts and Calculations:
Bollinger Bands:
Bollinger Bands are based on a simple moving average (SMA) of the price data, with upper and lower bands plotted at a specified number of standard deviations away from the SMA.
The distance between the bands widens during periods of increased price volatility and narrows during periods of low volatility, indicating potential trend reversals or breakouts.
The standard settings for Bollinger Bands typically involve a 20-period SMA and a 2 standard deviation distance for the upper and lower bands.
Probability Envelopes Indicator:
The Probability Envelopes Indicator calculates the expected price movements based on historical data and probabilities, utilizing mean and standard deviation calculations for both upward and downward price movements.
It generates upper and lower bands based on the calculated expected mean movement and the standard deviation of historical price changes, multiplied by a user-defined multiplier.
The Probability Envelopes Indicator also allows users to choose between using log returns or percentage changes for the calculations, adding flexibility to the indicator.
Key Differences:
Calculation Method: Bollinger Bands are based on a simple moving average and standard deviations, while the Probability Envelopes Indicator uses statistical probability calculations derived from historical price changes.
Flexibility: The Probability Envelopes Indicator allows users to choose between log returns or percentage changes and adjust the multiplier, offering more customization options compared to Bollinger Bands.
Risk Management: Bollinger Bands primarily focus on volatility, while the Probability Envelopes Indicator incorporates probability calculations to provide additional insights into potential price movements, which can be helpful for risk management purposes.
Complementary Use:
Using both Bollinger Bands and the Probability Envelopes Indicator in your trading strategy can offer valuable insights into market conditions and potential price levels.
Bollinger Bands can provide insights into market volatility and potential breakouts or trend reversals based on the widening or narrowing of the bands.
The Probability Envelopes Indicator can offer additional information on the expected price movements based on historical data and probabilities, which can be helpful in anticipating potential support and resistance levels.
Combining these two indicators can help traders to better understand market dynamics and increase their chances of identifying profitable trading opportunities.
In conclusion, while both Bollinger Bands and the Probability Envelopes Indicator aim to identify potential support and resistance levels, they differ significantly in their underlying concepts, calculations, and applications. By understanding these differences and incorporating both tools into your trading strategy, you can gain a more comprehensive understanding of the market and make more informed trading decisions.
In conclusion, the Probability Envelopes Indicator is a powerful and versatile technical analysis tool that offers unique insights into expected price movements based on historical data and probability calculations. It provides traders with the ability to identify potential support and resistance levels, as well as potential trend reversals. When compared to Bollinger Bands, the Probability Envelopes Indicator offers more customization options and incorporates probability-based calculations for a different perspective on market dynamics.
Although the Probability Envelopes Indicator has its limitations and potential cons, such as the reliance on historical data and the assumption that past performance is indicative of future results, it remains a valuable addition to any trader's toolkit. By using the Probability Envelopes Indicator in conjunction with other technical analysis tools, such as Bollinger Bands, traders can gain a more comprehensive understanding of the market and make more informed trading decisions.
Ultimately, the success of any trading strategy relies on the ability to interpret and apply multiple indicators effectively. The Probability Envelopes Indicator serves as a unique and valuable tool in this regard, providing traders with a deeper understanding of the market and its potential price movements. By utilizing this indicator in combination with other tools and techniques, traders can increase their chances of success and optimize their trading strategies.
Breaker Blocks with Signals [LuxAlgo]The Breaker Blocks with Signals indicator aims to highlight a complete methodology based on breaker blocks. Breakout signals between the price and breaker blocks are highlighted and premium/discount swing levels are included to provide potential take profit/stop loss levels.
This script also includes alerts for each signal highlighted.
🔶 SETTINGS
🔹 Breaker Blocks
Length: Sensitivity of the detected swings used to construct breaker blocks. Higher values will return longer term breaker blocks.
Use only candle body: Only use the candle body when determining the maximum/minimum extremities of the order blocks.
Use 2 candles instead of 1: Use two candles to confirm the occurrence of a breaker block.
Stop at first break of center line: Do not highlight breakout signals after invalidation until reset.
🔹 PD Array
Only when E is in premium/discount zone: Only set breaker block if point E of wave ABCDE is within the corresponding zone.
Show premium discount zone: Show premium/discount zone.
Highlight Swing Break: Highlight occurrences of price breaking a previous swing level.
Show Swings/PD Arrays: Show swing levels/labels and pd areas.
🔶 USAGE
The Breaker Blocks with Signals indicator aims to provide users with a minimalistic display alongside optimal signals to be aware of for finding trade setups as shown below.
Here we can see a MSS occurred allowing the indicator to detect a Breaker Block (-BB) & display a red arrow to confirm this signal.
The signal(s) that can be used for potential entries are only during retests of the breaker blocks.
A potential strategy traders could use with this indicator is to target the corresponding Discount PD Arrays detected (for a short position) and Premium PD Arrays (for a long position).
In the image above we can see price generated the potential entry signals in orange & fell to the Discount PD Arrays as a logical setup to look for with this indicator.
As we can see in the image above, signals can be considered invalid when price closes above the 50% level in which it would be suggested to wait for another setup.
Users still looking for more potential setups based on the same breaker block can disable the "Stop at first break of center line" setting within the settings menu.
In the image above we can see a bullish example whereas price confirmed a bullish breaker block (+BB), had a quick pullback into it that was confirmed by the green arrow, and then reached the Premium PD Arrays.
While retests of breaker blocks can still function well if they occur later in the price action, it's most preferable for users to look for entry signals that are near confirmed breaker blocks (5-10 bars) opposed to waiting 20+ bars.
Additional take profits based on the occurence of the breaker blocks are given in order to provide targets after the occurence of a breaker block breakout.
🔶 DETAILS
Breaker blocks are formed after a mitigated order block, these can provide change of polarity opportunities, thus playing a role as a potential support/resistance. It is the re-test/retrace of price to a breaker block that will set the conditions to provide signals.
The above chart describes the creation of a breaker block.
The signal generation logic makes use of various rules described below:
Bullish Breaker Blocks:
opening price is within the breaker block, while the closing price is above the upper extremity of the breaker block.
Price did not cross the breaker block average in the interval since the previous breakout.
Bearish Breaker Blocks:
opening price is within the breaker block, while the closing price is below the lower extremity of the breaker block.
Price did not cross the breaker block average in the interval since the previous breakout.
When a new pattern is formed, all previous drawings are removed.
🔶 RELATED SCRIPTS

SPY 4 Hour Swing TraderThe purpose of this script is to spot 4 hour pivots that indicate ~30 trading day swings. As VIX starts to drop options trading will get more boring and as we get back on the bull and can benefit from swing trading strategy. Swing trading doesn't make a whole lot of sense when VIX is above 28. Seems to get best results on 4 hour chart for this one. This indicator spots a go long opportunity when the 5 ema crosses the 13 ema on the 4 hour along with the RSI > 50 and the ADX > 20 and Stoichastic values (smoothed line < 80 or line < 90) and close > last candle close and the True Range < 6. It also spots uses a couple different means to determine when to exit the trade. Sell condition is primarily when the 13 ema crosses the 5 ema and the MACD line crosses below the signal line and the smoothed Stoichastic appears oversold (greater than 60) and slop of RSI < -.2. Stop Losses and Take Profits are configurable in Inputs along with ability to include short trades plus other MACD and Stoichastic settings. If a stop loss is encountered the trade will close. Also once twice the expected move is encountered partial profits will taken and stop losses and take profits will be re-established based on most recent close. Also a VIX above 28 will trigger any open positions to close. If trying to use this for something other than SPXL it is best to update stop losses and take profit percentages and check backtest results to ensure proper levels have been selected and the script gives satisfactory results.

SPY 1 Hour Swing TraderThe purpose of this script is to spot 1 hour pivots that indicate ~5 to 6 trading day swings. Results indicate that swings are held approximately 5 to 6 trading days on average, over the last 6 years. This indicator spots a go long opportunity when the 5 ema crosses the 13 ema on the 1 hour along with the RSI > 50. It also spots uses a couple different means to determine when to exit the trade. Sell condition is primarily when the 13 ema crosses the 5 ema and the MACD line crosses below the signal line and the smoothed Stoichastic appears oversold (greater than 60). Stop Losses and Take Profits are configurable in Inputs along with ability to include short trades plus other MACD and Stoichastic settings. If a stop loss is encountered the trade will close. Also once twice the expected move is encountered partial profits will taken and stop losses and take profits will be re-established based on most recent close. Once long trades are exited, short trades will be initiated if recent conditions appeared oversold and input option for short trading is enabled. If trying to use this for something other than SPXL it is best to update stop losses and take profit percentages and check backtest results to ensure proper levels have been selected and the script gives satisfactory results.

Lorentzian Classification Strategy Based in the model of Machine learning: Lorentzian Classification by @jdehorty, you will be able to get into trending moves and get interesting entries in the market with this strategy. I also put some new features for better backtesting results!
Backtesting context: 2022-07-19 to 2023-04-14 of US500 1H by PEPPERSTONE. Commissions: 0.03% for each entry, 0.03% for each exit. Risk per trade: 2.5% of the total account
For this strategy, 3 indicators are used:
Machine learning: Lorentzian Classification by @jdehorty
One Ema of 200 periods for identifying the trend
Supertrend indicator as a filter for some exits
Atr stop loss from Gatherio
Trade conditions:
For longs:
Close price is above 200 Ema
Lorentzian Classification indicates a buying signal
This gives us our long signal. Stop loss will be determined by atr stop loss (white point), break even(blue point) by a risk/reward ratio of 1:1 and take profit of 3:1 where half position will be closed. This will be showed as buy.
The other half will be closed when the model indicates a selling signal or Supertrend indicator gives a bearish signal. This will be showed as cl buy.
For shorts:
Close price is under 200 Ema
Lorentzian Classification indicates a selling signal
This gives us our short signal. Stop loss will be determined by atr stop loss (white point), break even(blue point) by a risk/reward ratio of 1:1 and take profit of 3:1 where half position will be closed. This will be showed as sell.
The other half will be closed when the model indicates a buying signal or Supertrend indicator gives a bullish signal. This will be showed as cl sell.
Risk management
To calculate the amount of the position you will use just a small percent of your initial capital for the strategy and you will use the atr stop loss or last swing for this.
Example: You have 1000 usd and you just want to risk 2,5% of your account, there is a buy signal at price of 4,000 usd. The stop loss price from atr stop loss or last swing is 3,900. You calculate the distance in percent between 4,000 and 3,900. In this case, that distance would be of 2.50%. Then, you calculate your position by this way: (initial or current capital * risk per trade of your account) / (stop loss distance).
Using these values on the formula: (1000*2,5%)/(2,5%) = 1000usd. It means, you have to use 1000 usd for risking 2.5% of your account.
We will use this risk management for applying compound interest.
> In settings, with position amount calculator, you can enter the amount in usd of your account and the amount in percentage for risking per trade of the account. You will see this value in green color in the upper left corner that shows the amount in usd to use for risking the specific percentage of your account.
> You can also choose a fixed amount, so you will have to activate fixed amount in risk management for trades and set the fixed amount for backtesting.
Script functions
Inside of settings, you will find some utilities for display atr stop loss, break evens, positions, signals, indicators, a table of some stats from backtesting, etc.
You will find the settings for risk management at the end of the script if you want to change something or trying new values for other assets for backtesting.
If you want to change the initial capital for backtest the strategy, go to properties, and also enter the commisions of your exchange and slippage for more realistic results.
In risk managment you can find an option called "Use leverage ?", activate this if you want to backtest using leverage, which means that in case of not having enough money for risking the % determined by you of your account using your initial capital, you will use leverage for using the enough amount for risking that % of your acount in a buy position. Otherwise, the amount will be limited by your initial/current capital
I also added a function for backtesting if you had added or withdrawn money frequently:
Adding money: You can choose how often you want to add money (Monthly, yearly, daily or weekly). Then a fixed amount of money and activate or deactivate this function
Withdraw money: You can choose if you want to withdraw a fixed amount or a percentage of earnings. Then you can choose a fixed amount of money, the period of time and activate or deactivate this function. Also, the percentage of earnings if you choosed this option.
Some other assets where strategy has worked
BTCUSD 4H, 1D
ETHUSD 4H, 1D
BNBUSD 4H
SPX 1D
BANKNIFTY 4H, 15 min
Some things to consider
USE UNDER YOUR OWN RISK. PAST RESULTS DO NOT REPRESENT THE FUTURE.
DEPENDING OF % ACCOUNT RISK PER TRADE, YOU COULD REQUIRE LEVERAGE FOR OPEN SOME POSITIONS, SO PLEASE, BE CAREFULL AND USE CORRECTLY THE RISK MANAGEMENT
Do not forget to change commissions and other parameters related with back testing results!. If you have problems loading the script reduce max bars back number in general settings
Strategies for trending markets use to have more looses than wins and it takes a long time to get profits, so do not forget to be patient and consistent !
Please, visit the post from @jdehorty called Machine Learning: Lorentzian Classification for a better understanding of his script!
Any support and boosts will be well received. If you have any question, do not doubt to ask!

On-Chart QQE of RSI on Variety MA [Loxx]On-Chart QQE of RSI on Variety MA (Quantitative Qualitative Estimation) is usually calculated using RSI. This version is uses an RSI of a Moving Average instead. The results are completely different than the original QQE. Also, this version is drawn directly on chart. There are four types of signals.
What is QQE?
Quantitative Qualitative Estimation (QQE) is a technical analysis indicator used to identify trends and trading opportunities in financial markets. It is based on a combination of two popular technical analysis indicators - the Relative Strength Index (RSI) and Moving Averages (MA).
The QQE indicator uses a smoothed RSI to determine the trend direction, and a moving average of the smoothed RSI to identify potential trend changes. The indicator then plots a series of bands above and below the moving average to indicate overbought and oversold conditions in the market.
The QQE indicator is designed to provide traders with a reliable signal that confirms the strength of a trend or indicates a possible trend reversal. It is particularly useful for traders who are looking to trade in markets that are trending strongly, but also want to identify when a trend is losing momentum or reversing.
Traders can use QQE in a number of different ways, including as a confirmation tool for other indicators or as a standalone indicator. For example, when used in conjunction with other technical analysis tools like support and resistance levels, the QQE indicator can help traders identify key entry and exit points for their trades.
One of the main advantages of the QQE indicator is that it is designed to be more reliable than other indicators that can generate false signals. By smoothing out the price action, the QQE indicator can provide traders with more accurate and reliable signals, which can help them make more profitable trading decisions.
In conclusion, QQE is a popular technical analysis indicator that traders use to identify trends and trading opportunities in financial markets. It combines the RSI and moving average indicators and is designed to provide traders with reliable signals that confirm the strength of a trend or indicate a possible trend reversal.
What is RSI?
RSI stands for Relative Strength Index . It is a technical indicator used to measure the strength or weakness of a financial instrument's price action.
The RSI is calculated based on the price movement of an asset over a specified period of time, typically 14 days, and is expressed on a scale of 0 to 100. The RSI is considered overbought when it is above 70 and oversold when it is below 30.
Traders and investors use the RSI to identify potential buy and sell signals. When the RSI indicates that an asset is oversold, it may be considered a buying opportunity, while an overbought RSI may signal that it is time to sell or take profits.
It's important to note that the RSI should not be used in isolation and should be used in conjunction with other technical and fundamental analysis tools to make informed trading decisions.
This indicator makes use of the following libraries:
Loxx's Moving Averages
Loxx's Expanded Source Types
Extras
Alerts
Signals
Signal Types
Change on Levels
Change on Slope
Change on Zero
Change on Original

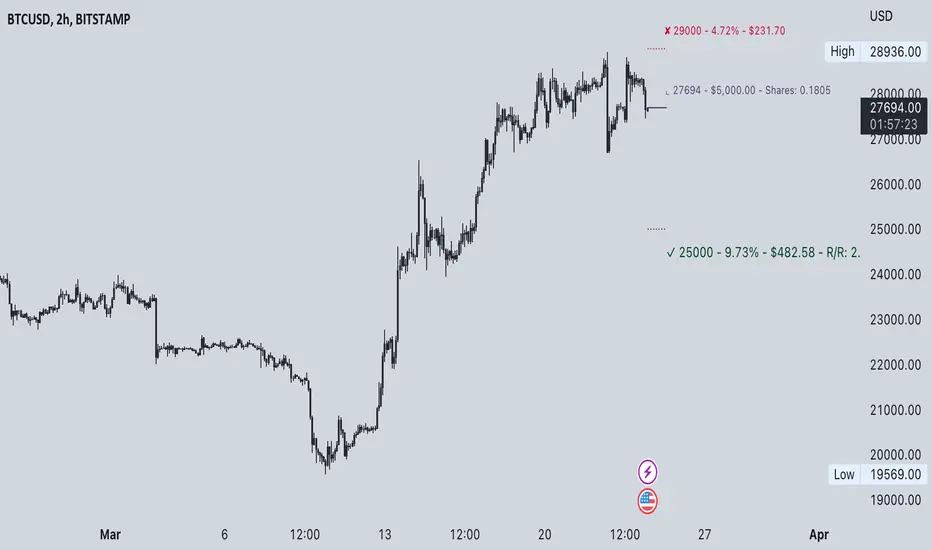
Commission-aware Trade LabelsCommission-aware Trade Labels
Description:
This library provides an easy way to visualize take-profit and stop-loss levels on your chart, taking into account trading commissions. The library calculates and displays the net profit or loss, along with other useful information such as risk/reward ratio, shares, and position size.
Features:
Configurable take-profit and stop-loss prices or percentages.
Set entry amount or shares.
Calculates and displays the risk/reward ratio.
Shows net profit or loss, considering trading commissions.
Customizable label appearance.
Usage:
Add the script to your chart.
Create an Order object for take-profit and stop-loss with desired configurations.
Call target_label() and stop_label() methods for each order object.
Example:
target_order = Order.new(take_profit_price=27483, stop_loss_price=28000, shares=0.2)
stop_order = Order.new(stop_loss_price=29000, shares=1)
target_order.target_label()
stop_order.stop_label()
This script is a powerful tool for visualizing your trading strategy's performance and helps you make better-informed decisions by considering trading commissions in your profit and loss calculations.
Library "tradelabels"
entry_price(this)
Parameters:
this : Order object
@return entry_price
take_profit_price(this)
Parameters:
this : Order object
@return take_profit_price
stop_loss_price(this)
Parameters:
this : Order object
@return stop_loss_price
is_long(this)
Parameters:
this : Order object
@return entry_price
is_short(this)
Parameters:
this : Order object
@return entry_price
percent_to_target(this, target)
Parameters:
this : Order object
target : Target price
@return percent
risk_reward(this)
Parameters:
this : Order object
@return risk_reward_ratio
shares(this)
Parameters:
this : Order object
@return shares
position_size(this)
Parameters:
this : Order object
@return position_size
commission_cost(this, target_price)
Parameters:
this : Order object
@return commission_cost
target_price
net_result(this, target_price)
Parameters:
this : Order object
target_price : The target price to calculate net result for (either take_profit_price or stop_loss_price)
@return net_result
create_take_profit_label(this, prefix, size, offset_x, bg_color, text_color)
Parameters:
this
prefix
size
offset_x
bg_color
text_color
create_stop_loss_label(this, prefix, size, offset_x, bg_color, text_color)
Parameters:
this
prefix
size
offset_x
bg_color
text_color
create_entry_label(this, prefix, size, offset_x, bg_color, text_color)
Parameters:
this
prefix
size
offset_x
bg_color
text_color
create_line(this, target_price, line_color, offset_x, line_style, line_width, draw_entry_line)
Parameters:
this
target_price
line_color
offset_x
line_style
line_width
draw_entry_line
Order
Order
Fields:
entry_price : Entry price
stop_loss_price : Stop loss price
stop_loss_percent : Stop loss percent, default 2%
take_profit_price : Take profit price
take_profit_percent : Take profit percent, default 6%
entry_amount : Entry amount, default 5000$
shares : Shares
commission : Commission, default 0.04%
SPY 1 Minute Day TraderWhen scalping options, users are looking for where breakouts are going to occur instead of sitting thru areas choppy price action that drain delta and cause them to lose value even if price is up trending. This script tries to identify when a trend reversal is expected based on one minute price action on the SPY. It alerts users to prepare for potential breakout when 5 out of the 6 key optimized parameters are discovered by showing a white L or S. Once all six trigger, it informs the user at the close of that candle with a golden triangle with Pivot Up or Pivot Down. As scalping options is something that is expected to be short in duration, a take profit and stop loss of 30 cents of price actions is established. If five or more parameters occur after the pivot is initiated, then stop losses and take profits are adhered to; however, if there are less, then it waits to take profit or stop the trade, as likely it is just noise and it will finish trend with an additional breakout.
This script has been created to take into account how the following variables impact trend for SPY 1 Minute:
ema vs 13 ema : A cross establishes start of trend
MACD (Line, Signal & Slope) : If you have momentum
ADX : if you are trending
RSI : If the trend has strength
The above has been optimized to determine pivot points in the trend using key values for these 6 indicators
bounce up = ema5 > ema13 and macdLine < .5 and adx > 20 and macdSlope > 0 and signalLine > -.1 and rsiSignal > 40
bounce down = ema5 < ema13 and macdLine > -.5 and adx > 20 and signalLine < 0 and macdSlope < 0 and rsiSignal < 60
White L's indicate that 5 of 6 conditions are met due to impending uptrend w/ missing one in green below it
Yellow L's indicate that 6 of 6 conditions still are met
White S's indicate that 5 of 6 conditions are met due to impending downtrend w/ missing condition in red above it
Yellow S's indicate that 6 of 6 conditions still are met
After a downtrend or uptrend is established, once it closes it can't repeat for 10 minutes
Won't open any trades on last two minutes of any hours to avoid volatility
Will close any open trades going into last minute of hour to avoid large overnight random swings.

Simple_RSI+PA+DCA StrategyThis strategy is a result of a study to understand better the workings of functions, for loops and the use of lines to visualize price levels. The strategy is a complete rewrite of the older RSI+PA+DCA Strategy with the goal to make it dynamic and to simplify the strategy settings to the bare minimum.
In case you are not familiar with the older RSI+PA+DCA Strategy, here is a short explanation of the idea behind the strategy:
The idea behind the strategy based on an RSI strategy of buying low. A position is entered when the RSI and moving average conditions are met. The position is closed when it reaches a specified take profit percentage. As soon as the first the position is opened multiple PA (price average) layers are setup based on a specified percentage of price drop. When the price hits the layer another position with the same position size is is opened. This causes the average cost price (the white line) to decrease. If the price drops more, another position is opened with another price average decrease as result. When the price starts rising again the different positions are separately closed when each reaches the specified take profit. The positions can be re-opened when the price drops again. And so on. When the price rises more and crosses over the average price and reached the specified Stop level (the red line) on top of it, it closes all the positions at once and cancels all orders. From that moment on it waits for another price dip before it opens a new position.
This is the old RSI+PA+DCA Strategy:
The reason to completely rewrite the code for this strategy is to create a more automated, adaptable and dynamic system. The old version is static and because of the linear use of code the amount of DCA levels were fixed to max 6 layers. If you want to add more DCA layers you manually need to change the script and add extra code. The big difference in the new version is that you can specify the amount of DCA layers in the strategy settings. The use of 'for loops' in the code gives the possibility to make this very dynamic and adaptable.
The RSI code is adapted, just like the old version, from the RSI Strategy - Buy The Dips by Coinrule and is used for study purpose. Any other low/dip finding indicator can be used as well
The distance between the DCA layers are calculated exponentially in a function. In the settings you can define the exponential scale to create the distance between the layers. The bigger the scale the bigger the distance. This calculation is not working perfectly yet and needs way more experimentation. Feel free to leave a comment if you have a better idea about this.
The idea behind generating DCA layers with a 'for loop' is inspired by the Backtesting 3commas DCA Bot v2 by rouxam .
The ideas for creating a dynamic position count and for opening and closing different positions separately based on a specified take profit are taken from the Simple_Pyramiding strategy I wrote previously.
This code is a result of a study and not intended for use as a full functioning strategy. To make the code understandable for users that are not so much introduced into pine script (like myself), every step in the code is commented to explain what it does. Hopefully it helps.
Enjoy!

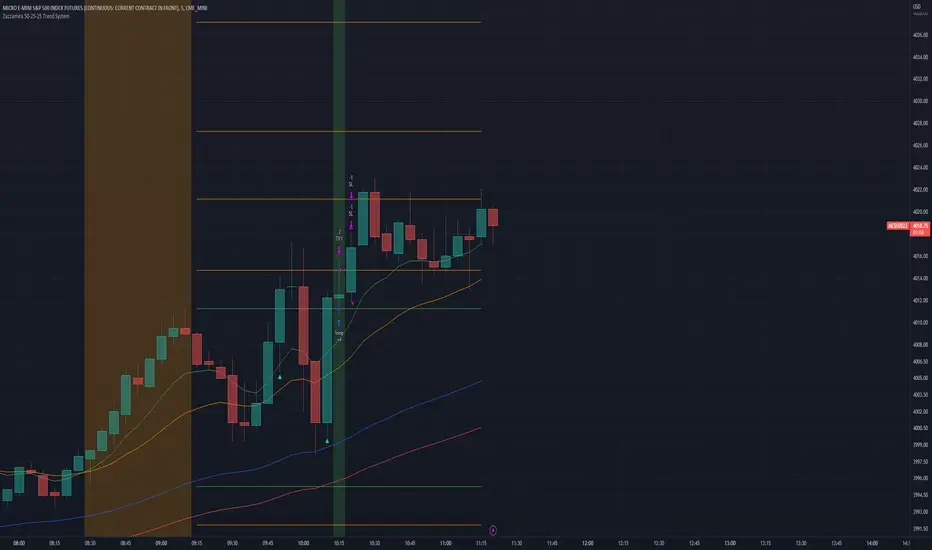
Zazzamira 50-25-25 Trend System Alerts OnlyPublishing my trading system script. It consist of several conditions to happen in order to open a trade. Work best on ES/MES 5 minute timeframe.
I like to use it with this settings:
- UTC -6 (don't tick Exchange Timezone)
and rest as default
To enter a trade, the following conditions must be met: Entry 1: the opening range (8:30AM - 9:15AM UTC-6) must be defined and the price must close above or below the opening range on the 5-minute timeframe. This entry condition defines the trade direction (above = long / below = short). Once the opening range is defined, the Trend-Based Fib Extension is applied from the range high to the range low (and vice versa). Fib levels are required for Exit conditions. Entry 2: the 8 - 27 - 67 - 97 EMAs must be defined. If the EMAs value order is 8 > 27 > 67 > 97, long-only trades are allowed. If the EMAs value order is 8 < 27 < 67 < 97, short-only trades are allowed. This entry condition filters fake breakouts of Entry 1. Entry 3: no trades are allowed after 12:59 UTC-6 (2PM EST). Entry 4: if Entry 1, Entry 2, and Entry 3 conditions are valid and the price hasn't reached the 23.6% Fib line, an entry order can be set at the range high/long with 4 contracts. To exit a trade, the following conditions must be met: Exit 1 (Stop loss): set a trailing stop based on 2.1x ATR (14) from entry. Exit 2: take 50% profits at the 23.6% Fib and leave trailing stop untouched. Exit 3: if Exit 2 triggers, take 50% (25% of total entry) off at 61.8% Fib, leaving Exit 2 trailing stop values valid. Exit 4: exit the full position at the FIB 100% value. Exit 5: all trades must be closed at 3pm UTC-6 (4PM EST). So basically Take Profit are 50%-25%-25% of position.
Code has been written by © Hiubris_Indicators who has been an amazing coder and gave me the possibility to make this script public so a really big shoutout to him.
This indicator only works for alerts, please check version without alerts to backtest or tweaks. This indicator is meant to be used to automate the system via webhooks

Zazzamira 50-25-25 Trend SystemPublishing my trading system script. It consist of several conditions to happen in order to open a trade. Work best on ES/MES 5 minute timeframe.
I like to use it with this settings:
- UTC -6 (don't tick Exchange Timezone)
and rest as default
To enter a trade, the following conditions must be met: Entry 1: the opening range (8:30AM - 9:15AM UTC-6) must be defined and the price must close above or below the opening range on the 5-minute timeframe. This entry condition defines the trade direction (above = long / below = short). Once the opening range is defined, the Trend-Based Fib Extension is applied from the range high to the range low (and vice versa). Fib levels are required for Exit conditions. Entry 2: the 8 - 27 - 67 - 97 EMAs must be defined. If the EMAs value order is 8 > 27 > 67 > 97, long-only trades are allowed. If the EMAs value order is 8 < 27 < 67 < 97, short-only trades are allowed. This entry condition filters fake breakouts of Entry 1. Entry 3: no trades are allowed after 12:59 UTC-6 (2PM EST). Entry 4: if Entry 1, Entry 2, and Entry 3 conditions are valid and the price hasn't reached the 23.6% Fib line, an entry order can be set at the range high/long with 4 contracts. To exit a trade, the following conditions must be met: Exit 1 (Stop loss): set a trailing stop based on 2.1x ATR (14) from entry. Exit 2: take 50% profits at the 23.6% Fib and leave trailing stop untouched. Exit 3: if Exit 2 triggers, take 50% (25% of total entry) off at 61.8% Fib, leaving Exit 2 trailing stop values valid. Exit 4: exit the full position at the FIB 100% value. Exit 5: all trades must be closed at 3pm UTC-6 (4PM EST). So basically Take Profit are 50%-25%-25% of position.
Code has been written by © Hiubris_Indicators who has been an amazing coder and gave me the possibility to make this script public so a really big shoutout to him.
Basic Position Calculator (BPC)In trading, proper position sizing is essential to managing risk and maximizing returns. The script provided is a Basic Position Calculator that allows traders to quickly and easily calculate their position size, stop loss, take profit, and risk reward ratio for a given trade.
The script starts by defining several inputs for the user to customize the calculations. The first input is the "Account Size", which specifies the total amount of funds available for the trade. The next input is "Risk Amount %", which is the percentage of the account size that the trader is willing to risk per trade. The "Stop Loss" input specifies the maximum amount of loss that the trader is willing to accept, while the "Reward" input is the desired profit target for the trade. Finally, there is a "Position" input that allows the user to specify where on the chart the table of calculations will be displayed.
The script then calculates the position size, stop loss, take profit and risk reward ratio using the user-specified inputs. The position size is calculated by dividing the risk amount by the stop loss. The stop loss is calculated by multiplying the stop loss percentage by the close price, and the take profit is calculated by multiplying the stop loss percentage by the close price and the reward. Risk-reward ratio is the ratio of amount of profit potential to the amount of risk in a trade.
The script then creates a table and displays the calculated values on the chart at the specified location. The table includes the following information: account size, position size, account risk %, stop loss, stop loss %, take profit, take profit % and risk reward ratio. This allows the trader to quickly and easily see all the key calculations for their trade in one place.
Overall, the Basic Position Calculator script is a valuable tool for any trader looking to quickly and easily calculate their position size, stop loss, take profit, and risk reward ratio for a given trade. The ability to customize the inputs and display the calculations on the chart makes it a useful and user-friendly tool for managing risk and maximizing returns.

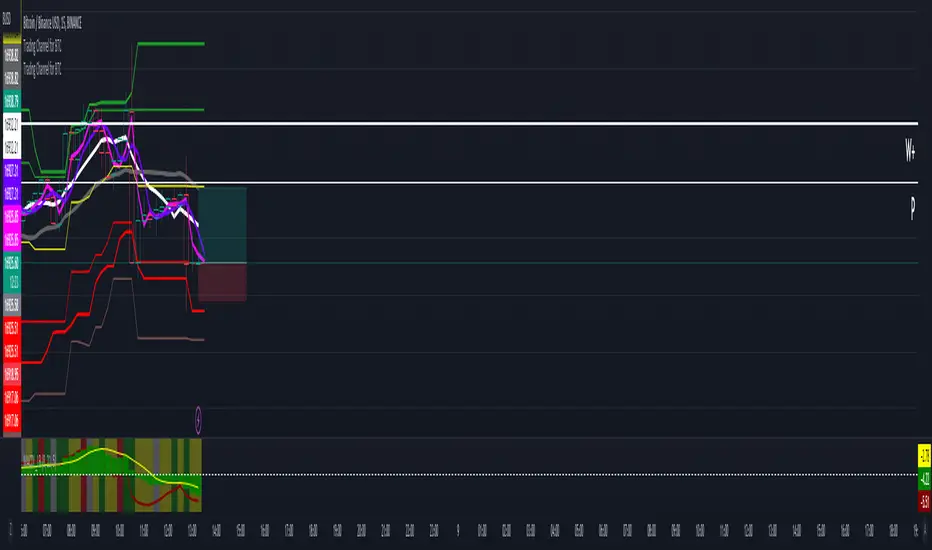
Trading Channel for BTCThe goal is to visualize, through basic but robust information, a channel that frames the price action, whose referenced limits and lines are indicative of potential entries and exits.
It is a simple but enormously reliable base for the development of different strategies.
The parameters for the script have been optimized for BTC. It shows good results in all time frames.
Red lines: support of closures and lows (indicative of potential points of purchase).
Green lines: resistance of closures and highs (indicative of potential points of sale).
Orange-gray line: proposed stop loss for long positions, at a ratio of 2:1.
Yellow line: midpoint of channel (as a reference for trend change detection or even possible take-profits).
White line: 8-period simple moving average (SMA).
Gray line: 21-period SMA.
Pink line: standard pivot.
Purple line: 3-period simple moving average pivot.
Blue lines (deactivated by default): standard range of support and resistance pivots (according to the studies of John L. Person).
A channel of support and resistance indicative of potential entry points is shown, both for short and long positions. The channel is based on the closures and the lowest and highest lows and highs of the last 21 periods, shifted one period.
In addition to showing the channel of support and resistance, the script also includes the display of two SMAs (simple moving averages) of 8 and 21 periods, as well as standard and 3-period simple moving average pivots, which can be used as support for entry decisions.
The script allows the user to develop more or less aggressive strategies, conditioning the entries to the price's contact, closure, or distance from the different proposed support and resistance lines, and confirming the same entries through possible SMA and/or pivot crosses, and exits in the same way.
The standard range of support and resistance lines, deactivated by default, is a consultation tool for the higher time frames (month, week, day) for the location of strong supports and resistances that may recommend or, on the contrary, discourage the execution of entries.
The strong point of the script is the visualization of a reliable channel within which the price action develops with basic and repetitive behavior: when the price touches one of the limits, it then goes to the opposite one. Based on that foundation, with the help of the indicators that are most familiar and/or reliable for the user, an infinity of strategies suitable for all types of traders can be developed.
This script is just a consultation tool with didactic goals, it should not be used as an investment recommendation and the information provided should not be relied upon as such.
----------
Se pretende visualizar por medio de información básica pero robusta, un canal que enmarca la acción del precio, cuyos límites y líneas referenciadas son indicativos de potenciales entradas y salidas.
Resulta una base simple pero enormemente confiable para el desarrollo de diferentes estrategias.
Los parámetros para el script han sido optimizados para BTC. Muestra buenos resultados en todos los marcos temporales.
Líneas rojas: soportes de cierres y mínimos (indicativas de puntos potenciales de compra).
Líneas verdes: resistencias de cierres y mínimos (indicativas de puntos potenciales de venta).
Línea gris anaranjada: propuesta de stop loss para posiciones en largo, a razón de 2:1.
Línea amarilla: punto medio de canal (como referencia para detección de cambios de tendencia o incluso posibles take-profit).
Línea blanca: SMA (promedio móvil simple) de 8 periodos.
Línea gris: SMA de 21 periodos.
Línea rosa: pivote estándar.
Línea morada: pivote de media simple de 3 periodos.
Líneas azules (desactivadas por defecto): abanico de pivotes de soportes y resistencias estándar (según los estudios de John L. Person).
Se muestra un canal de soportes y resistencias indicativas de puntos potenciales de entradas tanto en corto como en largo. El canal se basa en los cierres y los mínimos y máximos más bajos y más altos de los últimos 21 periodos, desplazados un periodo.
Además de mostrar el canal de soportes y resistencias, el script incluye también la visualización de dos SMA's (promedios móviles simples) de 8 y 21 periodos, así como pivotes estándar y de media simple de 3 periodos, que se pueden utilizar como apoyo para las decisiones de entrada.
El script permite al usuario desarrollar diferentes estrategias más o menos agresivas, condicionando las entradas al contacto, al cierre o al alejamiento del precio respecto a las diferentes líneas de soporte y resistencia propuestas, pudiendo confirmar las mismas entradas por posibles cruces de SMA's y/o pivotes, y las salidas de igual manera.
El abanico de soportes y resistencias estándar, desactivadas por defecto, son herramienta de consulta para los marcos temporales más altos (mes, semana, día) para localización de resistencias y soportes fuertes, que pudieran recomendar o, por el contrario, desaconsejar la ejecución de entradas.
El punto fuerte del script es la visualización de un canal confiable dentro del que se desarrolla la acción del precio con un comportamiento básico y repetitivo: al tocar el precio uno de los límites, se dirige después al opuesto. Sobre esa base, con la ayuda de los indicadores que resulten más conocidos y/o confiables para el usuario, se pueden desarrollar infinidad de estrategias adecuadas para todos los tipos de trader.
Este script es solo una herramienta de consulta con objetivos didácticos, no debe ser utilizado como recomendación de inversión y no se debe confiar en ella como tal.
Super 8 - 30M BTCWelcome to Super 8, the ultimate automatic trading script for Pine!
This bad boy is designed to go both long and short, and it's equipped with all the tools you need to maximize your profits. Whether you're looking to take profit, set a trailing stop, or protect yourself with a stop loss, Super 8 has you covered.
But that's not all! Super 8 is also loaded with 8 powerful indicators to help you make informed decisions. We've got the EMA, ADX, SAR, MACD, VOLUME, BOLLINGER BANDS, DONCHIAN, and ATR all working together to give you the best possible trading experience.
And if you want to take it to the next level, Super 8 also has a feature that lets you use stepped entries in normal mode or incremental 1,2,3,... to improve your average price. Plus, if you're using trailing stop, you can activate the Backtest precision to use lower timeframes.
But what's in a name? Super 8 is called that because it's just that... super! It's tailored specifically for the OKX:BTCUSDT.P pair, so you know you're getting the best possible results. it's highly adjustable and can be used with any other pair. So no matter what market you're trading in, Super 8 has got you covered.
So if you want to level up your trading game, give Super 8 a try. You won't be disappointed.
Certain Risks of Live Algorithmic Trading:
Backtesting Cannot Assure Actual Results.
The relevant market might fail or behave unexpectedly.
Your broker may experience failures in its infrastructure, fail to execute your orders in a correct or timely fashion or reject your orders.
The system you use for generating trading orders, communicating those orders to your broker, and receiving queries and trading results from your broker may fail.
Time lag at various point in live trading might cause unexpected behavior.
The systems of third parties in addition to those of the provider from which we obtain various services, your broker, and the applicable securities market may fail or malfunction.

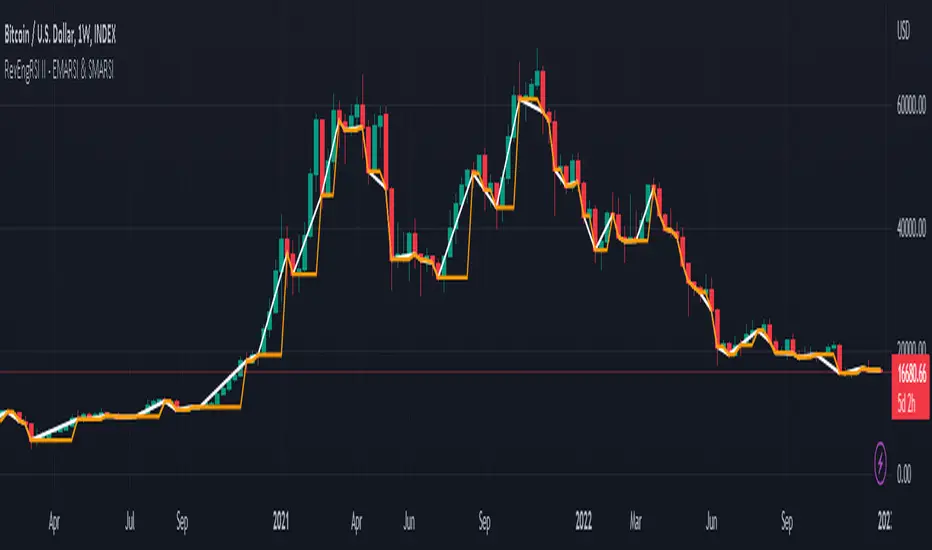
Reverse Engineering RSI II - EMARSI and SMARSIThis is the Reverse Engineering EMARSI and SMARSI Indicator.
It’s based on the work of Giorgos Siligardos on Reverse Engineering RSI.
The Reverse Engineering EMARSI and SMARSI Indicator shows the Exponential Moving Average and the Simple Moving Average of the RSI line but plotted in the price chart.
This script is also a complement of "Reverse Engineering RSI, by Giorgos Siligardos" script by HPotter but can also be used alone.
By default the RevEngSMARSI is turned off.
The RevEngEMARSI is the white line.
I’ve also added to the indicator:
1) Simple Moving Average (MA) of the EMARSI (EMARSI SMA) - Orange Line
2) Standard Deviation Bands for the EMARSI SMA - turned off by default
Using the settings I left in default (Length's = 1), we can see that when the EMARSI SMA is horizontal the price rises and so does the EMARSI. Also when the EMARSI SMA rises that's a signal that there is a resistance/support at that price. We can observe such thing if we draw horizontal lines at those prices. We can use this to help us put stop-losses and take profits. Also, those resistance/suport prices are ALWAYS the closing price of the first red candle after a bullish trend (big or small trends). Interesting...
When the EMARSI SMA rises and touches the EMARSI 3 things can happen:
- Bullish Trend slows down
- Correction of price
- Trend reversal
So, when the EMARSI SMA rises that can be interpreted as a signal for taking profits.
We should always wait for the price to close in the timeframe we're using, because sometimes the EMARSI SMA rises before the closing price and flattens again when is about to close.
However we should never take decisions based on 1 indicator. Our trading decision should always take in consideration multiple sources of information.
Of course we can use other settings for the trading. And if we do that we will observe different behaviours. And we should also study those behaviours. We can then use the crosses between the lines.
If there is something wrong with the code or its calculations, please let me know.
If you want to modify or improve the code, feel free to do that, but please let me know the changes you made.
This Indicator works in all timeframes. I hope you enjoy it!
Entry helperHello traders,
This is a script I use daily as a scalper and it helps me a lot, maybe it can help you, this is why I am sharing it!
PART 1 - DESCRIPTION
This program is specifically designed to help scalpers but can be used for all types of trading but won't be as useful.
This script is what I call an entry helper as it calculates dynamically the position size, stop loss and take profit levels and more.
When scalping and placing market entry orders, the price can move significantely while you are calculating your position size according to your stop loss, capital, risk and especially close price that changes very quickly, this results in a risk that is not ideally controlled and personally was a source of frustration and stress. I wanted to enter my quantity and stop loss values as fast as possible and make the process easier.
This script automates the calculation of the position size, stop loss and take profit levels according the the users input and prints the data visibly on the screen so it is easy to copy by the trader. It allows the trader to be confident that his risk is as controlled as possible.
The script is easy to use and set up, this guide will help you if you have any difficulies or questions.
PART 2 - HOW TO USE THE SCRIPT
- SET THE CAPITAL SETTINGS
1 - Set your capital value in $
- SET THE TRADE SETTINGS
2 - Set your trade side (BUY or SELL)
3 - Set you desired risk in % of your capital
- ENTRY SETTINGS
4 - Set your entry from 2 different options
|MARKET| (default option)
This option will place the entry level at the last available price
|LIMIT|
This option allows you to input a fixed price level for the entry
- STOP LOSS SETTINGS
5 - Select your stop loss placement from 4 different options
|EXTREMA STOP LOSS| (default option)
This option will place the stop loss at the highest/lowest (extrema) price level within the last N candles
|ATR EXTREMA|
This option uses the same price level as the EXTREMA STOP LOSS but will add/soustract the last ATR value (calculated on the N last candles) multiplied by a coefficient that you input
|TICKS EXTREMA|
This option uses the same price level as the EXTREMA STOP LOSS but will add/soustract a number of ticks that you input
|PRICE LEVEL|
This option allows you to input a fixed price level for the stop loss
- TAKE PROFIT SETTINGS
6 - Select your take profit from 3 different options
|NONE| (default option)
This option will not display any take profit level, I have added this option as I don't have take profit targets
|RR|
This option uses a risk to reward ratio (reward/risk) that you input, it will automatically calculate the take profit level that corresponds
|PRICE LEVEL|
This option allows you to input a fixed price level for the take profit
- QUANTITY AND FEE SETTINGS
7 - Set the quantity settings, it represents the quantity in a lot (usually 100 000 in forex, 100 in stocks 1 for crypto currencies)
8 - Set the fee per quantity (turning lot)
- VISUAL SETTINGS
9 - Show or remove the tab
- TAB SETTINGS
10 - Select the data that you want to display in the tab (the tab will adapt automatically)
NOTES:
The vertical dashed line shows what candle has been used for the calculation of the stop loss, it allows you to visualize what candle the script has selected in case of an EXTREMA stop loss option.
I hope this helps you out! Any suggestions are welcome and I hope that the guide is clear enough.
Happy trading!

SuperTrend Multi Time Frame Long and Short Trading Strategy
Hello All
This is non-repainting Supertrend Multi Time Frame script, I got so many request on Supertrend with Multi Time Frame. This is for all of them ..I am making it open for all so you can change its coding according to your need.
How the Basic Indicator works
SuperTrend is one of the most common ATR based trailing stop indicators.
In this version you can change the ATR calculation method from the settings. Default method is RMA.
The indicator is easy to use and gives an accurate reading about an ongoing trend. It is constructed with two parameters, namely period and multiplier. The default values used while constructing a Supertrend indicator are 10 for average true range or trading period and three for its multiplier.
The average true range (ATR) plays an important role in 'Supertrend' as the indicator uses ATR to calculate its value. The ATR indicator signals the degree of price volatility .
The buy and sell signals are generated when the indicator starts plotting either on top of the closing price or below the closing price. A buy signal is generated when the ‘Supertrend’ closes above the price and a sell signal is generated when it closes below the closing price.
It also suggests that the trend is shifting from descending mode to ascending mode. Contrary to this, when a ‘Supertrend’ closes above the price, it generates a sell signal as the colour of the indicator changes into red.
A ‘Supertrend’ indicator can be used on spot, futures, options or forex, or even crypto markets and also on daily, weekly and hourly charts as well, but generally, it fails in a sideways-moving market.
How the Strategy works
This is developed based on SuperTrend.
Use two time frame for confirm all entry signals.
Two time frame SuperTrend works as Trailing stop for both long and short positions.
More securely execute orders, because it is wait until confine two time frames(example : daily and 30min)
Each time frame developed as customisable for user to any timeframe.
User can choose trading position side from Long, Short, and Both.
Custom Stop Loss level, user can enter Stop Loss percentage based on timeframe using.
Multiple Take Profit levels with customisable TP price percentage and position size.
Back-testing with custom time frame.
This strategy is develop for specially for automation purpose.
The strategy includes:
Entry for Long and Short.
Take Profit.
Stop Loss.
Trailing Stop Loss.
Position Size.
Exit Signal.
Risk Management Feature.
Backtesting.
Trading Alerts.
Use the strategy with alerts
This strategy is alert-ready. All you have to do is:
Go on a pair you would like to trade
Create an alert
Select the strategy as a Trigger
Wait for new orders to be sent to you
This is develop for specially for automating trading on any exchange, if you need to get that automating service for this strategy or any Tradingview strategy or indicator please contact me I am have 8 year experience on that field.
I hope you enjoy it!
Thanks,
Ranga

RSI Buy & Sell Trading ScriptThis is my first attempt at a trading script using the RSI indicator for Buy & Sell signals (so please be nice but would appreciate any constructive comments).
Starting with $100 initial capital and using 10% per trade
You can select which month the backtesting starts
There is also a monthly table (sorry can’t remember who I got this from) that shows the total monthly profits, but you’ll need to turn it on by going into settings, Properties and in the Recalculate section tick the “On every tick” box
It should do the following:
Open Buy order if the RSI > 68 and the current Moving Average is greater than the previous Moving average
• TP1 = 50% of Order at 0.4%
• TP2 = 50% of order at 0.8%
• SL = 2% below entry
• Close Buy order if the RSI < 30
Open Sell order if the RSI < 28 and the current Moving Average is less than the previous Moving average
• TP1 = 50% of Order at 0.4%
• TP2 = 50% of order at 0.8%
• SL = 2% above entry
• Close Buy order if the RSI < 60
I would like to build on this if you have any ideas/ code that could help like the following:
• Move the SL to break even when it hits TP1
• Move the SL to TP1 when TP2 hits
• Moving take profit code so I can let the some of the trade stay in play (activate if it hits 1% profit and close trade if price retracts 0.5%)

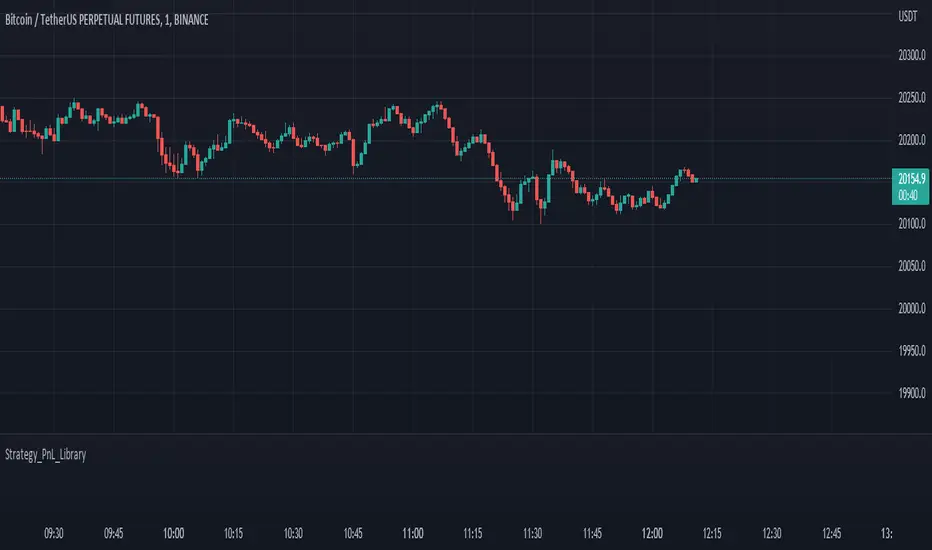
Strategy PnL LibraryLibrary "Strategy_PnL_Library"
TODO: This is a library that helps you learn current pnl of open position and use it to create your own dynamic take profit or stop loss rules based on current level of your profit. It should only be used with strategies.
inTrade()
inTrade: Checks if a position is currently open.
Returns: bool: true for yes, false for no.
notInTrade()
inTrade: Checks if a position is currently open. Interchangeable with inTrade but just here for simple semantics.
Returns: bool: true for yes, false for no.
pnl()
pnl: Calculates current profit or loss of position after the commission. If the strategy is not in trade it will always return na.
Returns: float: Current Profit or Loss of position, positive values for profit, negative values for loss.
entryBars()
entryBars: Checks how many bars it's been since the entry of the position.
Returns: int: Returns a int of strategy entry bars back. Minimum value is always corrected to 1 to avoid lookback errors.
pnlvelocity()
pnlvelocity: Calculates the velocity of pnl by following the change in open profit compared to previous bar. If the strategy is not in trade it will always return na.
Returns: float: Returns a float value of pnl velocity.
pnlacc()
pnlacc: Calculates the acceleration of pnl by following the change in profit velocity compared to previous bar. If the strategy is not in trade it will always return na.
Returns: float: Returns a float value of pnl acceleration.
pnljerk()
pnljerk: Calculates the jerk of pnl by following the change in profit acceleration compared to previous bar. If the strategy is not in trade it will always return na.
Returns: float: Returns a float value of pnl jerk.
pnlhigh()
pnlhigh: Calculates the highest value the pnl has reached since the start of the current position. If the strategy is not in trade it will always return na.
Returns: float: Returns a float highest value the pnl has reached.
pnllow()
pnllow: Calculates the lowest value the pnl has reached since the start of the current position. If the strategy is not in trade it will always return na.
Returns: float: Returns a float lowest value the pnl has reached.
pnldev()
pnldev: Calculates the deviance of the pnl since the start of the current position. If the strategy is not in trade it will always return na.
Returns: float: Returns a float deviance value of the pnl.
pnlvar()
pnlvar: Calculates the variance value of the pnl since the start of the current position. If the strategy is not in trade it will always return na.
Returns: float: Returns a float variance value of the pnl.
pnlstdev()
pnlstdev: Calculates the stdev value of the pnl since the start of the current position. If the strategy is not in trade it will always return na.
Returns: float: Returns a float stdev value of the pnl.
pnlmedian()
pnlmedian: Calculates the median value of the pnl since the start of the current position. If the strategy is not in trade it will always return na.
Returns: float: Returns a float median value of the pnl.
Coral Trend Pullback Strategy (TradeIQ)Description:
Strategy is taken from the TradeIQ YouTube video called "I Finally Found 80% Win Rate Trading Strategy For Crypto".
Check out the full video for further details/clarification on strategy entry/exit conditions.
The default settings are exactly as TradeIQ described in his video.
However I found some better results by some tweaking settings, increasing R:R ratio and by turning off confirmation indicators.
This would suggest that perhaps the current confirmation indicators are not the best options. I'm happy to try add some other optional confirmation indicators if they look to be more effective.
Recommended timeframe: 1H
Strategy incorporates the following features:
Risk management:
Configurable X% loss per stop loss
Configurable R:R ratio
Trade entry:
Based on strategy conditions below
Trade exit:
Based on strategy conditions below
Backtesting:
Configurable backtesting range by date
Trade drawings:
Each entry condition indicator can be turned on and off
TP/SL boxes drawn for all trades. Can be turned on and off
Trade exit information labels. Can be turned on and off
NOTE: Trade drawings will only be applicable when using overlay strategies
Alerting:
Alerts on LONG and SHORT trade entries
Debugging:
Includes section with useful debugging techniques
Strategy conditions
Trade entry:
LONG
C1: Coral Trend is bullish
C2: At least 1 candle where low is above Coral Trend since last cross above Coral Trend
C3: Pullback happens and price closes below Coral Trend
C4: Coral Trend colour remains bullish for duration of pullback
C5: After valid pullback, price then closes above Coral Trend
C6: Optional confirmation indicators (choose either C6.1 or C6.2 or NONE):
C6.1: ADX and DI (Single indicator)
C6.1.1: Green line is above red line
C6.1.2: Blue line > 20
C6.1.3: Blue trending up over last 1 candle
C6.2: Absolute Strengeh Histogram + HawkEye Volume Indicator (Two indicators combined)
C6.2.1: Absolute Strengeh Histogram colour is blue
C6.2.2: HawkEye Volume Indicator colour is green
SHORT
C1: Coral Trend is bearish
C2: At least 1 candle where high is below Coral Trend since last cross below Coral Trend
C3: Pullback happens and price closes above Coral Trend
C4: Coral Trend colour remains bearish for duration of pullback
C5: After valid pullback, price then closes below Coral Trend
C6: Optional confirmation indicators (choose either C6.1 or C6.2 or NONE):
C6.1: ADX and DI (Single indicator)
C6.1.1: Red line is above green line
C6.1.2: Blue line > 20
C6.1.3: Blue trending up over last 1 candle
C6.2: Absolute Strengeh Histogram + HawkEye Volume Indicator (Two indicators combined)
C6.2.1: Absolute Strengeh Histogram colour is red
C6.2.2: HawkEye Volume Indicator colour is red
NOTE: All the optional confirmation indicators cannot be overlayed with Coral Trend so feel free to add each separately to the chart for visual purposes
Trade exit:
Stop Loss: Calculated by recent swing low over previous X candles (configurable with "Local High/Low Lookback")
Take Profit: Calculated from R:R multiplier * Stop Loss size
Credits
Strategy origin: TradeIQ's YouTube video called "I Finally Found 80% Win Rate Trading Strategy For Crypto"
It combines the following indicators for trade entry conditions:
Coral Trend Indicator by @LazyBear (Main indicator)
Absolute Strength Histogram | jh by @jiehonglim (Optional confirmation indicator)
Indicator: HawkEye Volume Indicator by @LazyBear (Optional confirmation indicator)
ADX and DI by @BeikabuOyaji (Optional confirmation indicator)

Simple and Profitable Scalping Strategy (ForexSignals TV)Strategy is based on the "SIMPLE and PROFITABLE Forex Scalping Strategy" taken from YouTube channel ForexSignals TV.
See video for a detailed explaination of the whole strategy.
I'm not entirely happy with the performance of this strategy yet however I do believe it has potential as the concept makes a lot of sense.
I'm open to any ideas people have on how it could be improved.
Strategy incorporates the following features:
Risk management:
Configurable X% loss per stop (default to 1%)
Configurable R:R ratio
Trade entry:
Based on stratgey conditions outlined below
Trade exit:
Based on stratgey conditions outlined below
Backtesting:
Configurable backtesting range by date
Trade drawings:
Each entry condition indicator can be turned on and off
TP/SL boxes drawn for all trades. Can be turned on and off
Trade exit information labels. Can be turned on and off
NOTE: Trade drawings will only be applicable when using overlay strategies
Debugging:
Includes section with useful debugging techniques
Strategy conditions
Trade entry:
LONG
C1: On higher timeframe trend EMAs, Fast EMA must be above Slow EMA
C2: On higher timeframe trend EMAs, price must be above Fast EMA
C3: On current timeframe entry EMAs, Fast EMA must be above Medium EMA and Medium EMA must be above Slow EMA
C4: On current timeframe entry EMAs, all 3 EMA lines must have fanned out in upward direction for previous X candles (configurable)
C5: On current timeframe entry EMAs, previous candle must have closed above and not touched any EMA lines
C6: On current timeframe entry EMAs, current candle must have pulled back to touch the EMA line(s)
C7: Price must break through the high of the last X candles (plus price buffer) to trigger entry (stop order entry)
SHORT
C1: On higher timeframe trend EMAs, Fast EMA must be below Slow EMA
C2: On higher timeframe trend EMAs, price must be below Fast EMA
C3: On current timeframe entry EMAs, Fast EMA must be below Medium EMA and Medium EMA must be below Slow EMA
C4: On current timeframe entry EMAs, all 3 EMA lines must have fanned out in downward direction for previous X candles (configurable)
C5: On current timeframe entry EMAs, previous candle must have closed above and not touched any EMA lines
C6: On current timeframe entry EMAs, current candle must have pulled back to touch the EMA line(s)
C7: Price must break through the low of the last X candles (plus price buffer) to trigger entry (stop order entry)
Trade entry:
Calculated position size based on risk tolerance
Entry price is a stop order set just above (buffer configurable) the recent swing high/low (long/short)
Trade exit:
Stop Loss is set just below (buffer configurable) trigger candle's low/high (long/short)
Take Profit calculated from Stop Loss using R:R ratio
Credits
"SIMPLE and PROFITABLE Forex Scalping Strategy" taken from YouTube channel ForexSignals TV
